Crypto news report · source clearly identified
Bitcoin Holds Near $75K After Intraday Dip to $74,913
At 8:40 a.m. on September 16 2026, Bitcoin traded around $75,879 after a sharp sell‑off tested $74,913. Buyers reclaimed the $75,000 area, but short‑term momentum remains weak while longer‑term moving averages stay supportive.
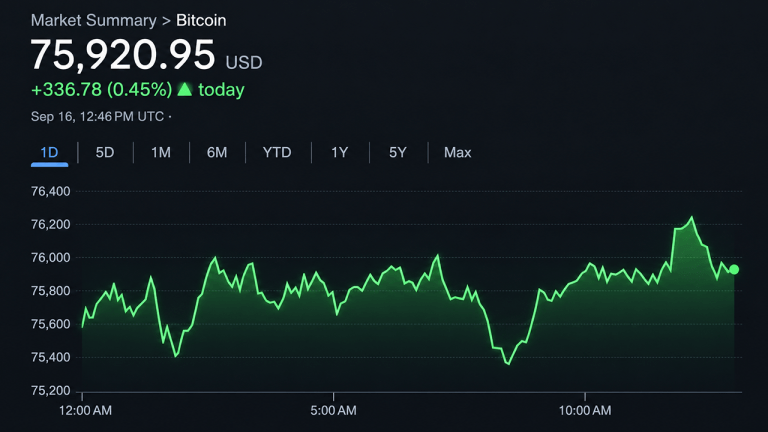
Bitcoin hovered near $75,879 on the morning of September 16 2026 after an intraday swing pushed the price down to $74,913. The recovery kept the cryptocurrency above a key support level, but technical indicators show mixed signals.
One‑Hour Chart: Support at $74,913
The 1‑hour chart highlighted a low of $74,913, followed by a bounce back to roughly $75,859. Holding above $74,900 would preserve the recent recovery, while a break below that level could establish a new lower low for the hour.
Four‑Hour Chart: Range Between $76,000 and $82,000
On the 4‑hour timeframe, Bitcoin moved sharply from a low near $62,470 to a high around $82,281 earlier in September. Since then, price has oscillated between $76,000 and $82,000, with current resistance forming near $76,000‑$77,000 and a stronger cluster at $79,800‑$82,300.
Daily Chart: Long‑Term Structure Intact
From April to mid‑September, Bitcoin’s swing high was about $82,833 and swing low around $57,735. Although the price sits below the recent September high, it remains above the 50‑, 100‑, and 200‑period exponential and simple moving averages, indicating that longer‑term bullish structure is still in place.
Momentum and Oscillators
Most daily oscillators are neutral, but momentum‑related readings are negative: the Momentum indicator and MACD both show bearish values, while the Bull‑Bear Power provides the sole positive signal.
Moving Averages: Short‑Term Bearish, Long‑Term Bullish
Short‑term EMAs (10, 20, 30) and SMAs (10, 20, 30) are all below price, signaling bearish pressure. In contrast, longer‑term EMAs (50, 100, 200) and SMAs (50, 100, 200) sit below the current price, offering support.
Outlook
A sustained move above $76,000‑$77,000 could reopen the $79,800‑$82,300 resistance zone. Conversely, a break and hold below $74,900 would create a fresh lower low on the 1‑hour chart and could shift momentum further bearish.
Source & attribution
News Source
- Publisher
- Bitcoin.com News
- Original date
- September 16, 2026, 1:15 PM
- Original headline
- Bitcoin Price Clings to $75K After a Nasty $74,913 Shakeout