Crypto news report · source clearly identified
Bitcoin Holds Near $76,500 as Bulls Guard Key Support
Bitcoin traded between $76,400 and $77,100 on September 2, 2026, after falling from an August 28 high of $81,455. The price is testing the $76,229 support level while broader daily trends remain bullish.
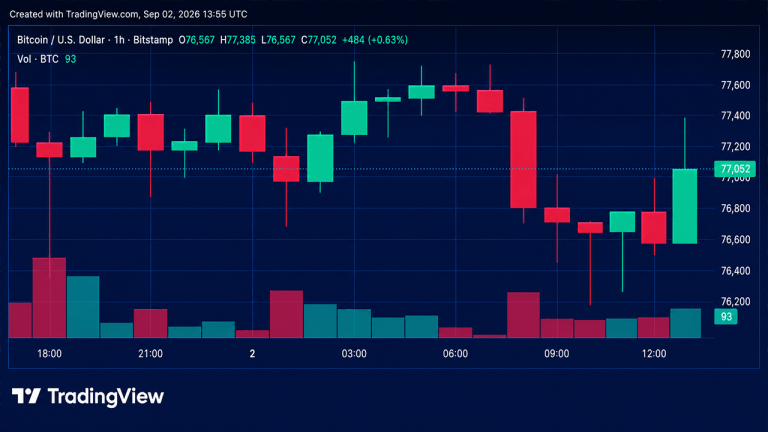
Bitcoin’s price hovered between $76,400 and $77,100 on the morning of September 2, 2026, after retreating from the August 28 peak of $81,455. The market is now focused on the $76,229 support zone, where short‑term weakness meets a stronger long‑term moving‑average structure.
1‑Hour Price Action
The 1‑hour chart showed a 2.2% decline from $78,542 to $76,810, with an intraday low at $76,229. A brief bounce lifted the price to $76,775 before slipping again to $76,568 and later returning to $76,810 on modest volume (≈17 BTC). Support is seen around $75,000‑$76,000, while resistance lies near $78,000‑$79,000. A close above $78,000 would suggest the sell‑off is absorbed; a close below $76,000 could invalidate the recent bounce.
4‑Hour Structure
On the 4‑hour chart, Bitcoin fell 0.66% from $77,328 to $76,819 after the August high. The price formed lower highs and tested $76,229 twice. Recent green candles showed low volume (84 BTC) compared with earlier declines (375‑875 BTC), indicating weaker buying pressure. Reclaiming $77,400‑$77,750 would negate the lower‑high pattern, while a break below $76,000 would expand the range low.
Daily Trend
Over the past day, Bitcoin rose 17.8% from $65,212.60 to $76,819.40, despite the pullback from $81,455. Support now extends from $76,000 down to the 20‑period VWMA at $75,055 and the 20‑period EMA at $74,594. Resistance spans $77,747 to roughly $79,250.
Oscillators and Moving Averages
Most daily oscillators (9 of 11) were neutral: RSI 63, Stochastic 75, CCI ~38, ADX 43, AO 8,231. Momentum (-801) and MACD Level (3,350) showed bearish readings. The daily moving averages gave mixed signals: short‑term EMAs/SMA (10‑period EMA $77,100, 10‑period SMA $78,348, 9‑period Hull $77,313) were bearish, while longer‑term EMAs/SMA (20‑, 30‑, 50‑, 100‑, 200‑period) and the 20‑period VWMA were bullish.
Outlook
Bullish view: Holding above most longer‑term averages and a potential move above $77,000 could reframe the recent weakness as a pullback.
Bearish view: Lower highs and difficulty sustaining a rebound above $76,229 keep short‑term downside risk alive. A break below $76,000 would weaken the bounce further.
Source & attribution
News Source
- Publisher
- Bitcoin.com News
- Original date
- September 2, 2026, 2:15 PM
- Original headline
- Bitcoin Price Gets Squeezed Below $78K as Bulls Defend the Floor