Crypto news report · source clearly identified
Bitcoin Holds Above Key Moving Averages While Short‑Term Momentum Stalls Near $80,400
Bitcoin trades around $80,440, staying above most daily moving averages but facing resistance near $82,000. The 1‑hour and 4‑hour charts show a cooled rally after a $7,000 rebound, while the daily trend remains bullish.
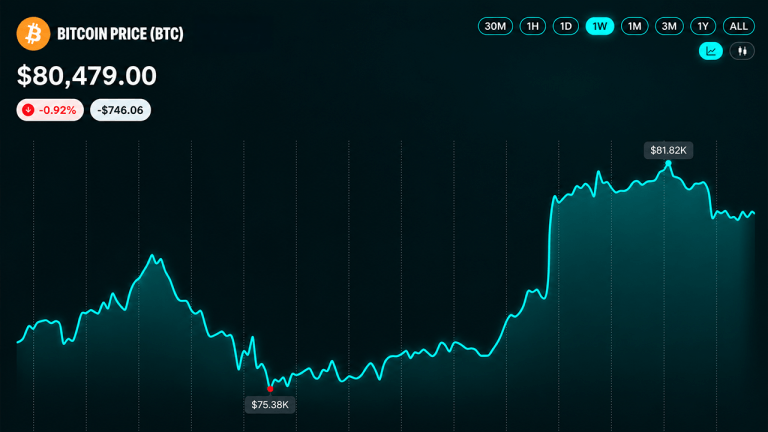
Bitcoin is hovering near $80,440 on Sunday morning, down about 1% over the past 24 hours. The price remains above the majority of daily moving averages, indicating a still‑intact longer‑term uptrend, yet shorter‑term charts reveal a loss of momentum as the rally stalls below the $82,000 resistance zone.
1‑hour view: A rapid rebound loses steam
During the past week the 1‑hour chart captured a sharp swing from the mid‑$70,000s to a low of $74,913 on September 16, followed by a swift climb to $81,914 on September 18‑19. The $7,000 gain quickly met resistance, and red hourly candles pulled the price back toward $80,300‑$80,500. Current support sits around $80,000‑$80,300, with the next resistance band at $81,500‑$81,914. The short‑term trading range is therefore roughly $80,000 to $81,900.
4‑hour view: $82,000 remains a barrier
On the 4‑hour chart Bitcoin rose from a low near $63,989 in mid‑August to a peak of $82,281, then fell back to the mid‑$70,000s before attempting another push toward $82,000. That attempt also faltered, leaving the price near $80,400. Immediate resistance lies between $81,500 and $82,300, while support is anchored at $79,500‑$80,000. A deeper break could revive the prior swing‑low area around $76,000‑$76,500.
Daily perspective: The broader uptrend holds
The daily structure stretches from a low of $57,735 in June/July to a high of $82,833. Bitcoin remains comfortably above the mid‑$70,000 base set in August. Resistance clusters between $82,000 and $82,833, and support is positioned around $76,000‑$78,000. A daily close below roughly $76,700, near the 30‑period EMA, would signal the first clear breach of the post‑July uptrend.
Technical indicators: Mixed signals
Oscillators are largely neutral: RSI at 61, Stochastic at 87, CCI at 107 (negative), ADX at 41, and MACD at 1,389 (negative). Momentum indicators show a split view, reflecting consolidation beneath resistance.
Moving averages: Bullish bias
Thirteen of fifteen tracked moving averages are positive, with Bitcoin above the EMA and SMA for the 10‑, 20‑, 30‑, 50‑, 100‑, and 200‑period windows. The only bearish reading is the fast Hull MA at $81,075, which sits above the current price.
Outlook
For bulls, reclaiming $81,075 and then breaking above $81,914‑$82,833 would reinforce the rebound. For bears, a drop below $80,000 could expose the next support at $79,000 and potentially reopen the deeper $76,000‑$78,000 zone.
Source & attribution
News Source
- Publisher
- Bitcoin.com News
- Original date
- September 20, 2026, 1:45 PM
- Original headline
- Bitcoin Price Hits an $82K Wall After a Wild $7,000 Comeback