Crypto news report · source clearly identified
Bitcoin Price Rejected at $80.5K as Bulls Scramble to Defend $79K
Bitcoin’s price was trading between $79,300 and $79,500 on Sept. 7 after a significant rejection from $80,537 left its short-term price action caught between fading momentum and a still-constructive daily trend.
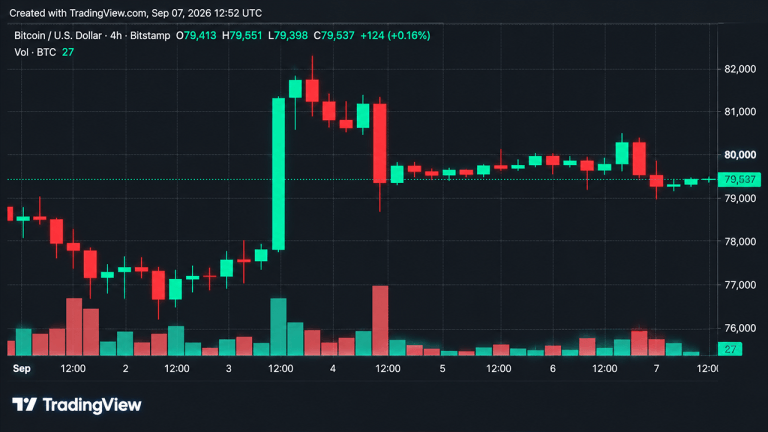
On September 7, 2026, Bitcoin’s price hovered between $79,300 and $79,500 after a sharp rejection at $80,537. The move left the market confined to an intraday range of $79,013‑$80,537, with key support and resistance levels shaping the near‑term outlook.
Hourly Rebound Struggles
The 1‑hour chart showed a rapid decline from roughly $80,200‑$80,537 to $79,013, followed by a modest bounce toward $79,500‑$79,520 on thin volume. Small‑bodied candles after the low indicate a repair bounce rather than a confirmed recovery, and order flow thinned below $79,000.
Four‑Hour Balance
On the 4‑hour timeframe, the price failed to sustain $80,500, triggering an impulsive drop to $79,013 with the session’s largest volume bars. Subsequent candles traded in a narrow band between $79,000 and $79,600, suggesting a post‑impulse balance. A close above $80,000‑$80,537 could reopen the path to the September 3 high, while a close below $79,013 would re‑expose the $76,300‑$77,000 region.
Daily Uptrend Remains Intact
Despite the short‑term weakness, Bitcoin stayed above its key daily moving averages, preserving the higher‑time‑frame uptrend. Resistance is identified near $80,494‑$80,537 and again at $82,108, while support extends from $79,013‑$79,081 down toward $76,298‑$76,767.
Momentum Indicators
Daily oscillators present a mixed picture: RSI at 64, Stochastic around 62, and CCI near 69 are neutral to bullish, while the MACD at 3,107 signals bearish pressure. The Awesome Oscillator and Momentum indicator remain bullish, but overall momentum is not fully reclaimed.
Moving Averages Support the Bullish Bias
Thirteen of fifteen daily moving averages are bullish, including the 10‑period EMA at $78,966 and the 200‑period EMA at $72,710. The Hull MA at $80,469 is the sole bearish signal. The broader technical structure stays constructive as long as price defends $79,013 and remains above major daily averages.
Key Levels to Watch
- Support: $79,013 (primary), $76,300‑$77,000 (secondary)
- Resistance: $80,537 (first), $82,108 (next)
Outlook
If Bitcoin holds above $79,013 and can push back through $80,537, the bullish case strengthens and $82,108 becomes a realistic target. Conversely, a break below $79,013 would confirm a deeper correction, bringing the $76,300‑$77,000 zone back into focus.
Source & attribution
News Source
- Publisher
- Bitcoin.com News
- Original date
- September 7, 2026, 1:15 PM
- Original headline
- Bitcoin Price Rejected at $80.5K as Bulls Scramble to Defend $79K