Crypto news report · source clearly identified
Bitcoin Holds Near $83.4K Amid Mixed Short‑Term Signals
Bitcoin traded at $83,428 on Thursday, up 2.4% in 24 hours but still about 4.5% below its recent September peak of $87,374. Daily charts stay bullish while 4‑hour and 1‑hour timeframes show a corrective phase, keeping the $82,800‑$83,200 zone in focus.
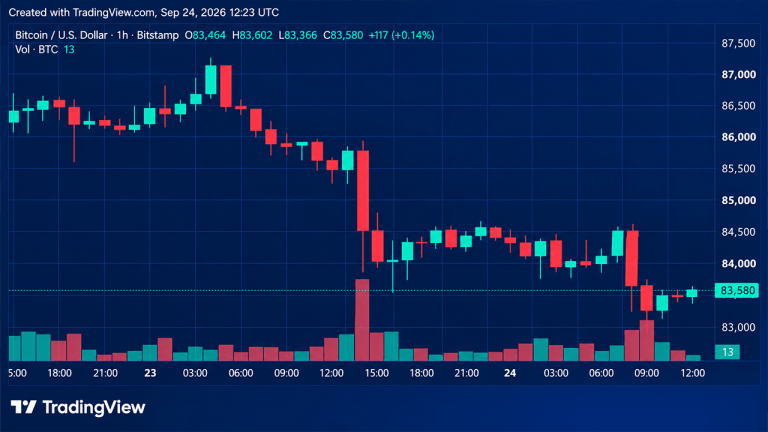
Bitcoin’s price settled at $83,428.53 on Thursday morning, marking a 2.4% rise over the previous day but remaining roughly 4.5% below the September high of $87,374. The market is therefore caught between a broader uptrend and a shakier short‑term picture.
Short‑Term Pressure on the 1‑Hour Chart
The 1‑hour chart shows a stair‑step decline after the run to $87,374, with lower highs forming. Bitcoin briefly bounced to the $83,000‑$83,400 range, where order‑book data on Bitstamp indicated buying interest in the low‑$83,000s. Sellers retain control as long as price stays below the mid‑$84,000s. A clear break below the current bounce low could extend the pullback, while a sustained move above the mid‑$84,000s would improve the short‑term structure.
4‑Hour Chart Highlights a Post‑Peak Hangover
On the 4‑hour timeframe, Bitcoin surged from a mid‑September swing low of $74,913 to $87,374 before entering a series of lower highs and red candles that pushed it back into the low‑$83,000s. The next key reclaim area is the mid‑$84,000s, with the immediate support zone at $82,800‑$83,200. A loss of this zone could expose the $70,000‑$80,000 range.
Daily Chart Still Bullish
Zooming out to the daily chart reveals a multi‑month uptrend from $57,735 to $87,374, with the current pullback representing a correction rather than a full reversal. The congestion zone spans the high‑$70,000s to low‑$80,000s. A daily close above $85,900‑$87,400 would bring the recent peak back into play, while a break below the low‑$80,000s would increase pressure on the September rally.
Oscillator and Moving Average Context
Oscillators differ across timeframes: the daily RSI sits at 62, while the 4‑hour and 1‑hour RSIs are 47 and 36 respectively, indicating weaker short‑term momentum. Moving averages on the daily chart place the 10‑period EMA ($82,185) and SMA ($81,195) below the current price, supporting the longer‑term bullish bias. Shorter‑term averages on the 4‑hour chart remain above spot, while longer‑term averages stay below.
Outlook
Bullish view: Maintaining the $82,800‑$83,200 support and reclaiming $84,500 could reopen the path to $85,876 and the $87,374 peak.
Bearish view: Continued short‑term seller dominance and a break below $82,800 would push price toward $82,000, then $81,000‑$81,500, with the high‑$70,000s at risk.
Source & attribution
News Source
- Publisher
- Bitcoin.com News
- Original date
- September 24, 2026, 1:30 PM
- Original headline
- Bitcoin Price Retreats From September Highs With $82.8K in the Crosshairs