Crypto news report · source clearly identified
Bitcoin’s bottom signal flashes but six‑month data warns early buyers
VanEck recorded eight active signals on Aug. 12, while comparable clusters trailed Bitcoin’s baseline at 90 and 180 days.
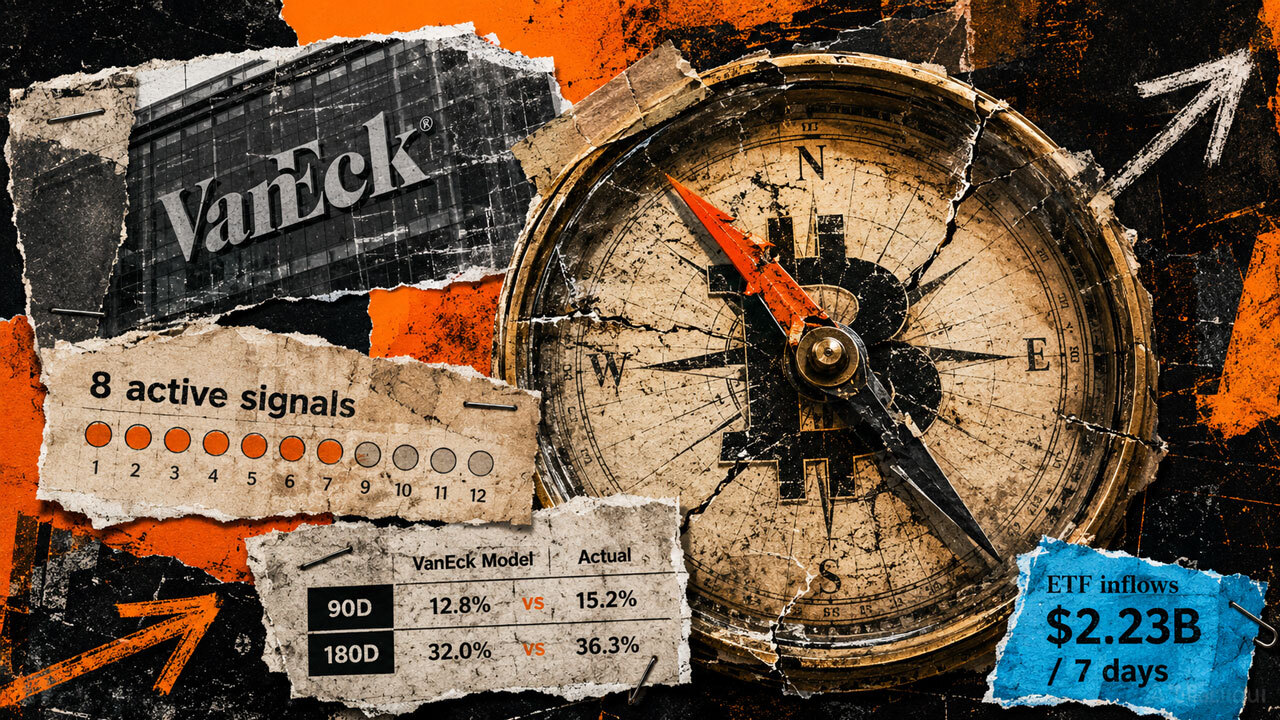
Bitcoin’s late‑August rally unfolded in stages, beginning with a sharp reset of bearish positioning and later supported by ETF inflows and wallet accumulation.
Capitulation snapshot and signal count
On Aug. 12 VanEck’s capitulation dashboard showed eight of its 12 indicators active, a level that normally signals broad market stress. The dashboard’s eight‑signal count relies on a rule where eleven indicators use historical percentile extremes and one indicator fires after a price drop of at least 35 %.
Timing performance of signal clusters
VanEck’s forward‑return table shows that on days when eight to twelve signals were active, Bitcoin under‑performed its all‑days baseline over the next 90 and 180 days (12.8 % vs 15.2 % and 32.0 % vs 36.3 % respectively). The one‑year return was higher (166.2 % vs 96.0 %), but the sample consists of 115 heavily overlapping observation days, meaning the observations are not independent.
Market dynamics after the snapshot
Glassnode identified Aug. 19 as the largest single‑day Bitcoin short‑liquidation event since 2019, with shorts accounting for about 85 % of liquidations. Futures open interest fell 11 % and funding rates stayed near neutral, indicating a short‑covering rally rather than a leveraged long chase.
Subsequent data showed strong ETF activity: $2.23 billion of U.S. spot Bitcoin ETF creations over seven days and average daily ETF turnover of $2.4 billion. Wallet‑size accumulation scores rose to neutral or above across all cohorts, suggesting broader participation beyond the initial short‑covering.
Long‑term holder dynamics
VanEck reported a decline of 356,534 BTC held for more than one year over a 30‑day period, representing 59.1 % of circulating supply. The report did not break down the cause of the decline, leaving uncertainty about whether it reflects wallet churn, migration, or distribution by older holders.
Overall assessment
The evidence points to a staged recovery: an initial capitulation‑driven rally, followed by ETF inflows and on‑chain accumulation. However, VanEck’s strongest signal clusters did not outperform Bitcoin’s baseline within six months, and the one‑year advantage stems from overlapping observations rather than independent market bottoms.
Source & attribution
News Source
- Publisher
- CryptoSlate
- Original date
- August 27, 2026, 4:45 PM
- Original headline
- Bitcoin’s bottom signal is flashing, but six months of data shows a trap waiting for early buyers