Crypto news report · source clearly identified
Bitcoin’s Price Refused to Break at $76K, but $79K Won’t Give
Bitcoin’s price is back near $77,800 after buyers stepped in around $76,370 and turned an ugly overnight drop into a fast rebound. Short‑term momentum is picking up, longer moving averages stay positive, but the market faces a ceiling near $78,300‑$79,000.
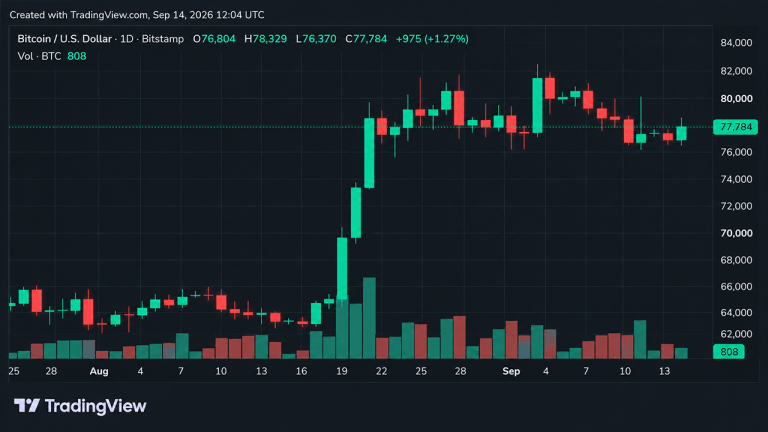
Bitcoin showed a sharp V‑shaped recovery on the 1‑hour chart, bouncing from a low of $76,370 to a high of $78,329 before settling near $77,800. The rebound kept short‑term structure constructive, yet the price now faces a persistent resistance zone around $78,300‑$79,000.
1‑Hour Chart: Quick Reversal
The price fell to $76,370 before buyers pushed it up to $78,329. The market now hovers between $77,400 and $77,700, providing a potential launch pad for another attempt at $78,300‑$78,400. A break above that range could open the path to $79,000‑$79,500, while a dip below $77,000 would weaken the rebound.
4‑Hour Chart: Overhead Resistance
On the 4‑hour timeframe, Bitcoin is testing the $78,300‑$79,000 ceiling. A decisive close above $79,000 would target the recent high near $79,837 and set the stage for $79,800‑$80,000. Failure at this level could pull the price back toward $77,000 and the stronger $76,000‑$76,500 support area.
Daily Chart: Consolidation Zone
Bitcoin’s longer‑term view shows a range between roughly $76,000 and $82,000 after a prior swing from $62,470 to $82,281. The $80,000 psychological level remains crucial; reclaiming it and the $82,281‑$82,833 zone would signal a broader bullish shift.
Oscillators: Mixed Signals
Technical oscillators are largely neutral: RSI at 57, Stochastic at 20, Stochastic RSI fast at 11, and most other indicators showing no clear bias. Momentum is slightly positive, while MACD is negative, indicating indecision.
Moving Averages: Mostly Positive
Eleven moving‑average readings are positive, with Bitcoin sitting near the 10‑day EMA ($77,757) and above the 20‑day EMA ($77,079). However, the 10‑day SMA ($78,157), 20‑day SMA ($78,443) and VWMA ($78,504) sit above the current price, forming a near‑term resistance cluster.
Outlook
For bulls, breaking above $78,500 and then $79,000 could reopen the route to $80,000 and higher. For bears, rejection around $78,300‑$79,000 followed by a slide below $77,000 would retest $76,370 and potentially expose the lower $74,000s.
Source & attribution
News Source
- Publisher
- Bitcoin.com News
- Original date
- September 14, 2026, 12:30 PM
- Original headline
- Bitcoin’s Price Refused to Break at $76K, but $79K Won’t Give