Crypto news report · source clearly identified
Bitcoin Price Escapes $74.9K Low, but the Easy Part May Be Over
At 8:45 a.m. Eastern time, bitcoin’s price is trading between $76,875 and $77,083 per coin on Thursday, Sept. 17, caught between a broader recovery structure that still has some life and short‑term charts that keep flashing caution.
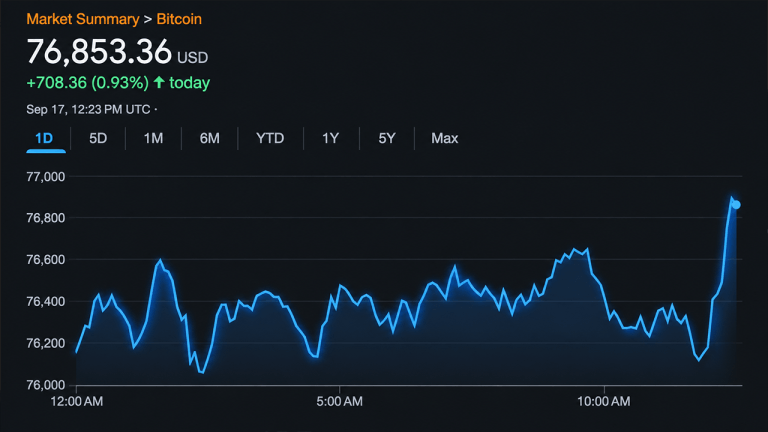
Bitcoin rebounded from a low near $74,960 and is now trading in the $76,875‑$77,083 range. The price action sits between a longer‑term recovery framework and short‑term technical signals that remain mixed.
1‑Hour Momentum Fades
On the 1‑hour chart, Bitcoin rose from about $74,962 to a high of $76,701 before losing steam near the $77,000‑$77,200 zone. Recent candles show sellers pushing the price back toward roughly $76,160, with relatively light volume. An aggressive entry could be considered around $75,900‑$76,100 if support holds; a clearer bullish signal would require a decisive break above $76,700. Below $75,900, the next support levels are near $75,500 and $74,950.
4‑Hour Chart Shows Resistance
The 4‑hour chart reflects a tougher environment. After climbing from the August low of $62,653 to a peak near $82,281, Bitcoin has been forming lower highs and is now confined to the $76,000‑$78,000 band. The immediate resistance pocket sits at $76,900‑$77,200. A reclaim of $77,000 would improve the structure and bring $77,500‑$78,000 back into view. Failure at current levels could see price test $75,500 and $74,900.
Daily Structure and Key Levels
On the daily chart, Bitcoin remains near the lower edge of its recent range. The $75,000‑$76,000 zone acts as a crucial support area; a daily close below $75,000 could open the path to $74,000‑$73,000. On the upside, $78,000 is the first significant hurdle, followed by stronger resistance around $79,500‑$80,000.
Oscillators and Moving Averages
Oscillator readings are split: two negative, seven neutral, and two positive. The RSI sits at 48, while most other indicators are neutral. Momentum‑based tools such as MACD lean negative, whereas Williams %R and bull‑bear power are positive, indicating no clear consensus.
Moving averages present a mixed picture. Short‑term EMAs and SMAs (10‑, 20‑, 30‑period) are mostly negative, while longer‑term EMAs and SMAs (50‑, 100‑, 200‑period) remain positive. The overall moving‑average gauge is neutral, suggesting Bitcoin is caught between near‑term weakness and a healthier longer‑term trend.
Outlook
Bullish view: A clean break above $76,700‑$77,000 could reopen $77,500‑$78,000 as a target and reinforce the broader recovery structure.
Bearish view: Failure to hold above $76,700‑$77,000, especially a daily close below $75,000, could expose the market to a decline toward $74,000‑$73,000.
Source & attribution
News Source
- Publisher
- Bitcoin.com News
- Original date
- September 17, 2026, 12:45 PM
- Original headline
- Bitcoin Price Escapes $74.9K Low, but the Easy Part May Be Over