Crypto news report · source clearly identified
Bitcoin Price Falls From $82K, $78,000 Becomes Key Support
Bitcoin’s price was caught between short-term selling pressure and a still-rising daily trend Friday, Sept. 4, after a surge to $82,281 gave way to a retreat into the $79,000 area. The reversal puts a great deal of attention on whether buyers can defend nearby support while the broader technical picture remains supported by daily moving averages.
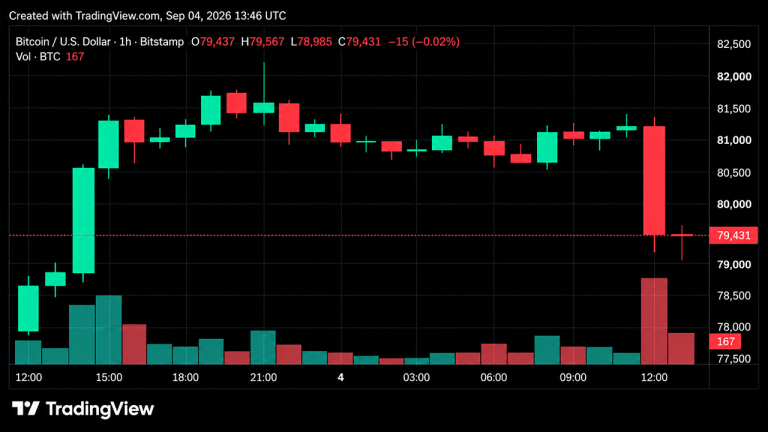
Bitcoin slipped from a high of $82,281 on September 4, pulling back into the $79,000 range and highlighting $78,531 as a critical support level.
1‑Hour Reversal Highlights Short‑Term Support
The 1‑hour chart showed a rapid swing from a wick at $82,281 to a large red candle that pushed price into a cluster of bids between $78,990 and $79,230. Volume on the decline exceeded typical 1‑hour bars, and the $78,500‑$79,200 pocket is now being defended. A break below $78,000 could trigger a move toward the $76,567‑$77,300 area, while holding above $79,400 and $80,335 would improve the short‑term outlook.
4‑Hour Chart Shows a Failed Extension
On the 4‑hour timeframe, price rose from the mid‑$70,000s to $82,281 before a high‑volume reversal, indicating a failed extension. Retaining the $80,300‑$81,400 resistance band would suggest the pullback is only a 4‑hour shakeout. Conversely, a drop below $78,500 toward $76,800 would invalidate Thursday’s breakout.
Daily Trend Remains Intact
Despite Friday’s give‑back, the daily chart shows price staying above the September 2 close near $77,300 and above the daily moving‑average stack. Resistance levels include the Fibonacci first resistance at $81,430 and the Camarilla second resistance at $82,098. A daily close above $81,430‑$82,281 would confirm the September 3 breakout; a close below $76,800‑$77,300 would put the impulse at risk.
Oscillators Indicate Neutral Momentum
Daily oscillators are largely neutral: RSI 66, Stochastic 73, CCI 71, ADX 45, Awesome Oscillator 8,044, Momentum 1,214, and MACD 3,425 (bearish). The gauge shows two negative, nine neutral, and no bullish readings, suggesting weaker momentum despite bullish moving averages.
Moving Averages Keep a Bullish Bias
Fourteen of fifteen daily moving‑average readings are bullish. Bitcoin traded above all listed EMAs and SMAs, but just below the 9‑period Hull MA at 79,420. A break above that could target $80,335 and $81,430, while downside risk centers on $78,531 and the $76,800‑$77,300 range.
At 10 a.m. Eastern time, Bitcoin was priced at $79,339.
Source & attribution
News Source
- Publisher
- Bitcoin.com News
- Original date
- September 4, 2026, 2:30 PM
- Original headline
- Bitcoin Price Plunges From $82K as $78,000 Becomes the Line