Crypto news report · source clearly identified
Bitcoin’s Daily Chart Shows Golden Cross Signal
A golden cross has appeared on Bitcoin’s daily price chart, suggesting a possible long‑term bullish trend.
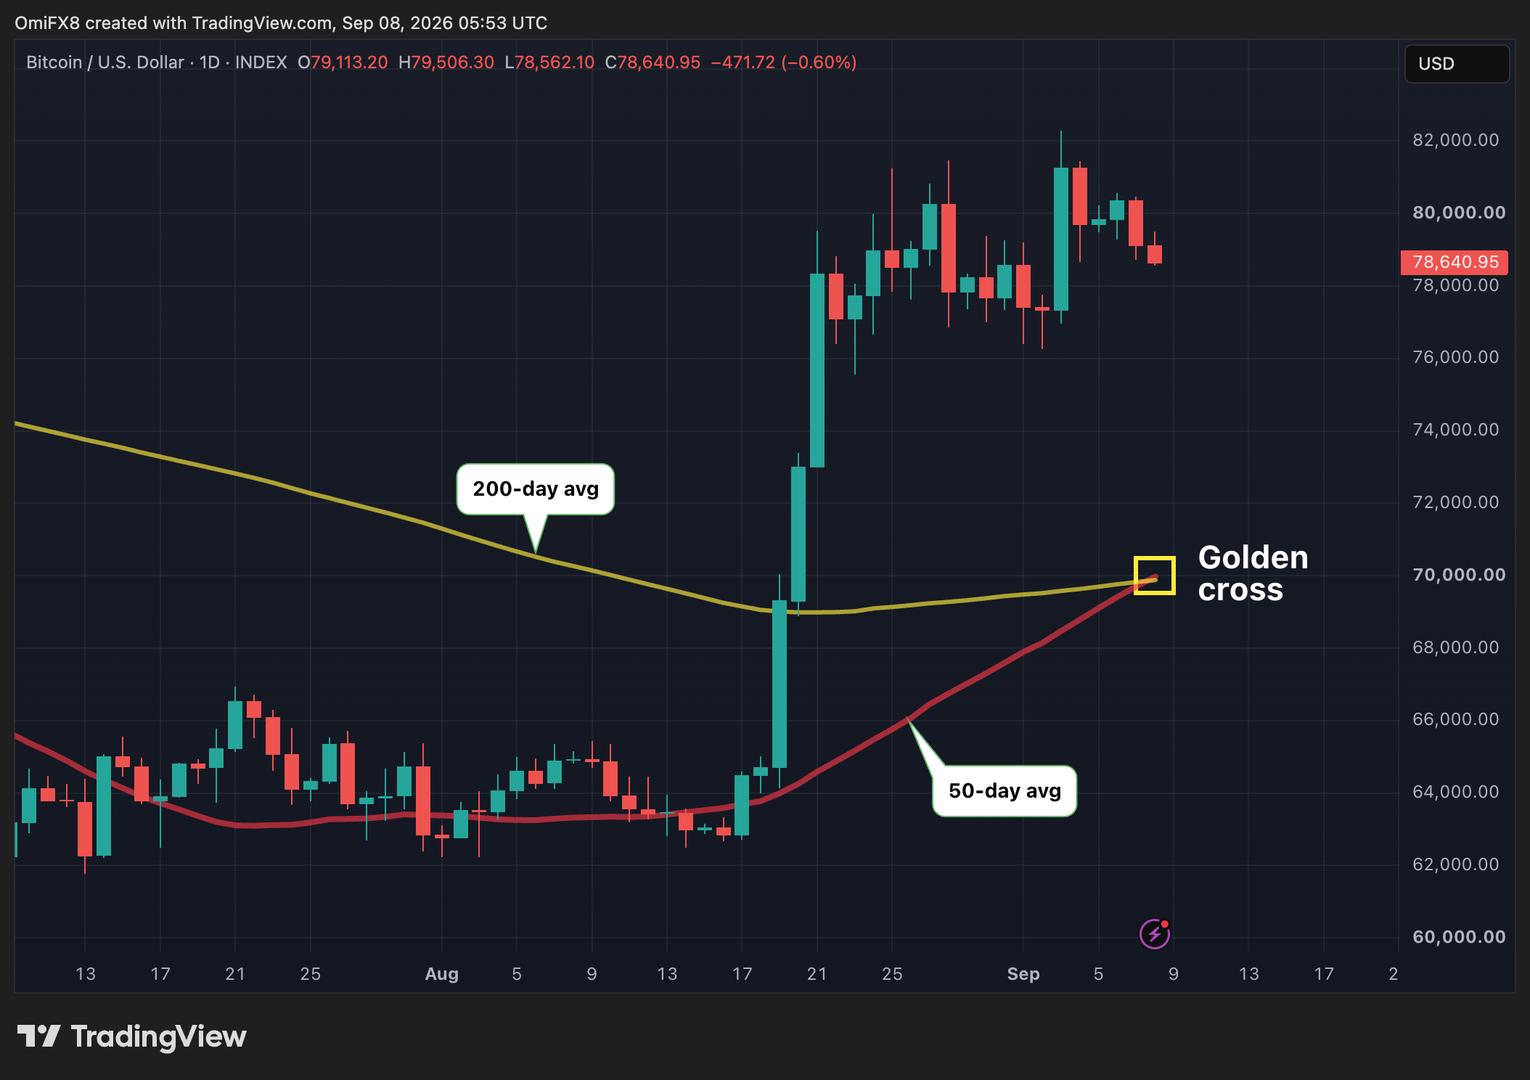
A golden cross has formed on Bitcoin’s daily chart, a technical pattern where the 50‑day moving average moves above the 200‑day moving average. Traders often view this as a signal that the asset could enter a sustained upward phase.
What a Golden Cross Means
The crossover of short‑term and long‑term averages is commonly interpreted as a shift toward bullish momentum. While it does not guarantee price gains, it is historically associated with periods of extended price appreciation.
Implications for Bitcoin
With the golden cross now in place, market participants may look for higher price targets and increased buying interest. The pattern suggests that, if the trend holds, Bitcoin could experience a longer‑term rally.
Source & attribution
News Source
- Publisher
- CoinDesk
- Original date
- September 8, 2026, 5:56 AM
- Original headline
- Bitcoin’s golden cross is here