Crypto news report · source clearly identified
Bitcoin Holds Near $76K Amid Mixed Short‑Term Signals
Bitcoin is trading between $76,400 and $76,700, with short‑term momentum turning bearish while longer‑term moving averages remain supportive.
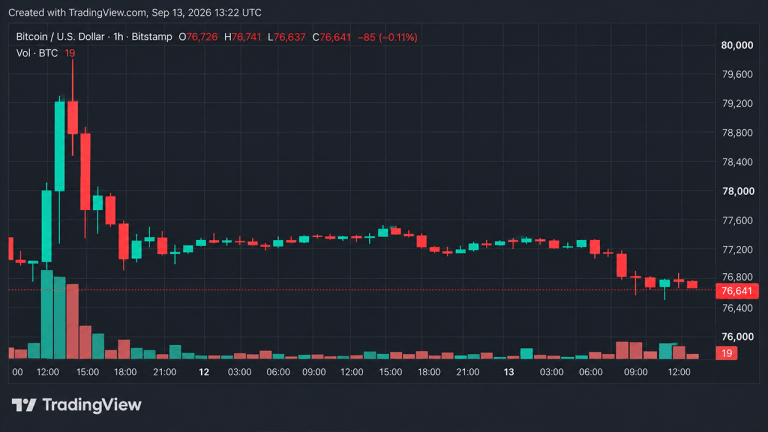
Bitcoin’s price is currently confined to a narrow band around $76,400‑$76,700. The recent swing from a high of $79,837 to a low of $76,040 on September 12 illustrates the volatility that has settled into a tighter range.
1‑Hour Outlook
The 1‑hour chart shows Bitcoin squeezed between roughly $76,600 and $77,300. Buyers are active near $76,500‑$76,600, while sellers dominate the $77,300‑$77,500 area. A break above $77,500 could reopen the path toward $79,800, whereas a dip below $76,040 would expose the $75,000‑$74,000 zone.
4‑Hour Outlook
Since early September, the 4‑hour chart has produced lower highs, pulling the price back toward the mid‑$76,000s. Defending the $76,400‑$76,600 region could enable a move toward $78,000‑$78,500. A close below this range would shift sentiment, with $80,000 and the $82,000‑$82,300 resistance levels becoming the next hurdles.
Daily Outlook
On the daily chart, Bitcoin remains well above July’s low of $57,735 and above most long‑term moving averages. The price has been rejected twice near $82,300‑$82,800, but buyers continue to hold the $76,000‑$76,500 area, with additional support around $74,000‑$75,200. A decisive reclaim of $78,500 would strengthen the bullish case, while a drop below $74,000 would signal a shift.
Oscillator Summary
- RSI: 53 (neutral)
- Stochastic: 17 (the only bullish reading)
- Momentum and MACD: bearish
- Other oscillators (CCI, ADX, AO, StochRSI, Williams %R, BBP, UO): neutral
The oscillator mix yields two bearish, eight neutral, and one bullish signal.
Moving Average Perspective
Bitcoin trades below its short‑term EMAs and SMAs (10‑ and 20‑period), which sit between $77,000 and $78,550, creating immediate resistance. However, it stays above the 30‑, 50‑, 100‑, and 200‑period EMAs and SMAs, as well as the Hull MA, indicating longer‑term strength. Overall, nine moving averages are bullish, five are bearish, and one is neutral.
Key Takeaways
- Short‑term momentum is bearish, keeping price below $78,500.
- Long‑term trend remains intact, with price above major longer‑term averages.
- Support zones: $76,000 and $74,000‑$75,200.
- Resistance zones: $77,500, $78,500, $80,000, and $82,300‑$82,800.
Source & attribution
News Source
- Publisher
- Bitcoin.com News
- Original date
- September 13, 2026, 2:15 PM
- Original headline
- Bitcoin’s Price Looks Shaky at $76K, but the Trend Says Otherwise