BTC $84,692.00 ▲ 1.40% ETH $2,705.37 ▲ 0.73% BNB $770.86 ▲ 0.07% XRP $1.49 ▼ 0.05% SOL $118.74 ▲ 0.66% TRX $0.3343 ▼ 1.07% FIGR_HELOC $1.02 ▼ 0.71% ZEC $1,334.06 ▼ 6.17% HYPE $87.87 ▼ 2.35% DOGE $0.0939 ▼ 0.88% LINK $14.23 ▼ 1.08% XMR $545.42 ▼ 0.03% WBT $84.61 ▲ 1.36% ADA $0.2456 ▼ 0.82%
72 Greed

Bitcoin Market Cycle: On-Chain Data Shows Bull Transition

Original title: How To Know The Bitcoin Bear Market Is Over (It Is) | James Check

BTC Sessions 1:04:29 112 views on YouTube BTC +1.4% FORM +0.6%
Thumbnail for How To Know The Bitcoin Bear Market Is Over (It Is) | James Check 1:04:29

Watch on YouTube Opens on youtube.com in a new tab. Playback here uses youtube-nocookie.com.

Summary

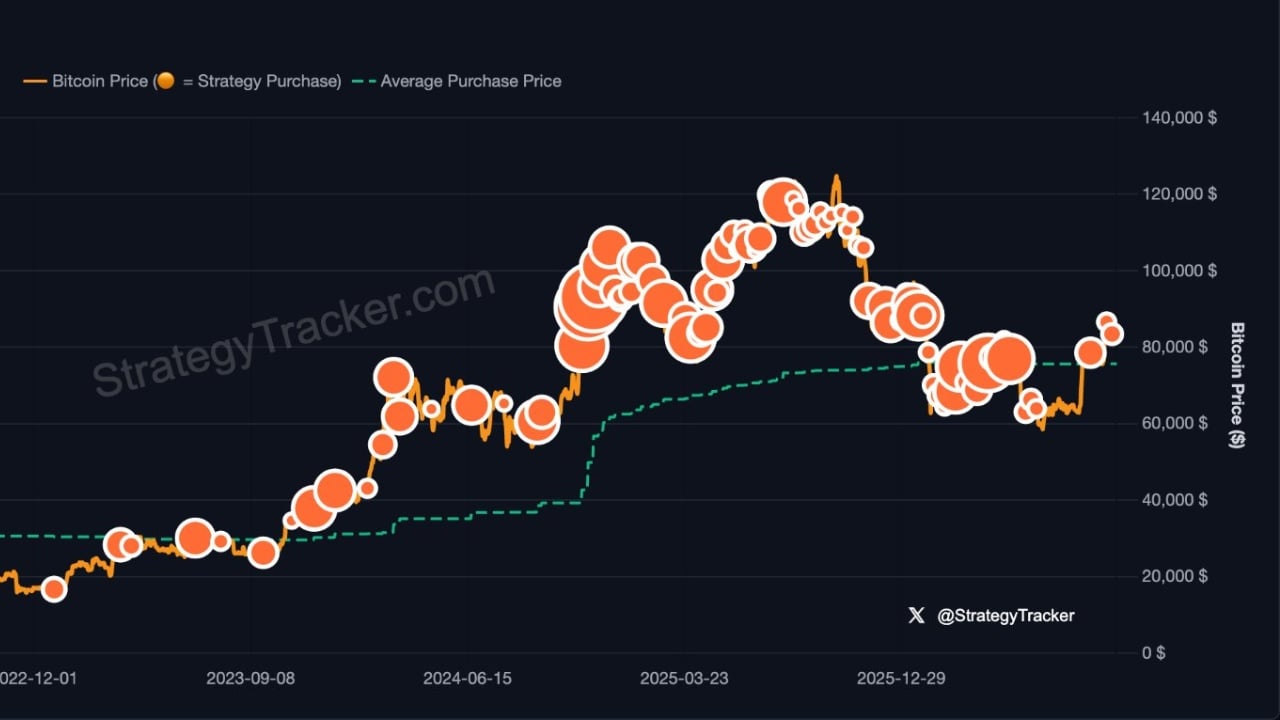
Bitcoin's market cycle has shifted from bear to bull, according to on-chain data. More than half of all invested wealth is now in profit, up from 8% at the $58K lows. The move from the low $60s to $86K showed how short-term and long-term holder cost basis can act as resistance. A four-phase market cycle model frames holder behavior. The data also shows that 90% of ETF buyers were underwater before $8 billion in outflows hit the bottom. ETFs bought tops and sold bottoms. About 20% of coins drive 55% drawdowns. $100K is described as resistance. Low-fee ETF flows are gaining traction. Housing markets are pushing rotation into Bitcoin. Bitcoin is not set and forget. The DCA strategy remains active, with purchases maxed at $60K. Bull market lines of defense and the hot ball of money are tracked. AI CapEx is compared to Bitcoin mining. A disbelief rally remains alive. Other on-chain topics include wealth in profit, cost basis, ETF flows, holder behavior, and macro trends. Price pain versus time pain capitulation, two legs up and short squeezes, and volume rising across exchanges are also part of the cycle.

This AI summary uses the title, description and tags. It may miss context from the full video. How summaries are checked

Key points

  1. More than half of all invested wealth is now in profit, up from 8% at the $58K lows.
  2. The run from the low $60s to $86K revealed on-chain changes.
  3. A four-phase market cycle model describes holder behavior.
  4. 90% of ETF buyers were underwater before $8 billion in outflows hit the bottom.
  5. About 20% of coins drive 55% drawdowns.
  6. $100K is described as resistance.

Chapters

Chapters come from the timestamps in the video description.

Questions

What share of invested wealth is in profit?
More than half, up from 8% at the $58K lows.
What happened to ETF buyers before the bottom?
90% of ETF buyers were underwater before $8 billion in outflows hit the bottom.
What is $100K described as?
Resistance.

Related briefs

A video appearing here is not an endorsement. Crypto assets can lose value. This page provides information, not investment advice.