


How RWA Tokenisation and Stablecoins Distort Altseason Charts
Original title: Tokenisation Is Breaking Your Altseason Chart
 15:52
15:52
Watch on YouTube Opens on youtube.com in a new tab. Playback here uses youtube-nocookie.com.
Summary
This AI summary uses the title, description and tags. It may miss context from the full video. How summaries are checked
Key points
- Bitcoin dominance is often shown at 59 percent, but reaches 65 percent when digital dollars are removed.
- Stablecoins and tokenised gold are included in standard altcoin market charts.
- One dollar in every seven inside the OTHERS chart is not an altcoin.
- Out of 115 coins in OTHERS in January 2024, only two beat Bitcoin over the next two years.
- Token unlock supply inflates market capitalisation every year.
Chapters
Chapters come from the timestamps in the video description.
Questions
What is the true Bitcoin dominance when digital dollars are removed?
How many coins in OTHERS beat Bitcoin from January 2024 over the next two years?
Related briefs

Analyst outlines BTC, ETH and XRP long-term breakout targets
Analyst Ali Martinez outlined long-term chart targets for major crypto assets.
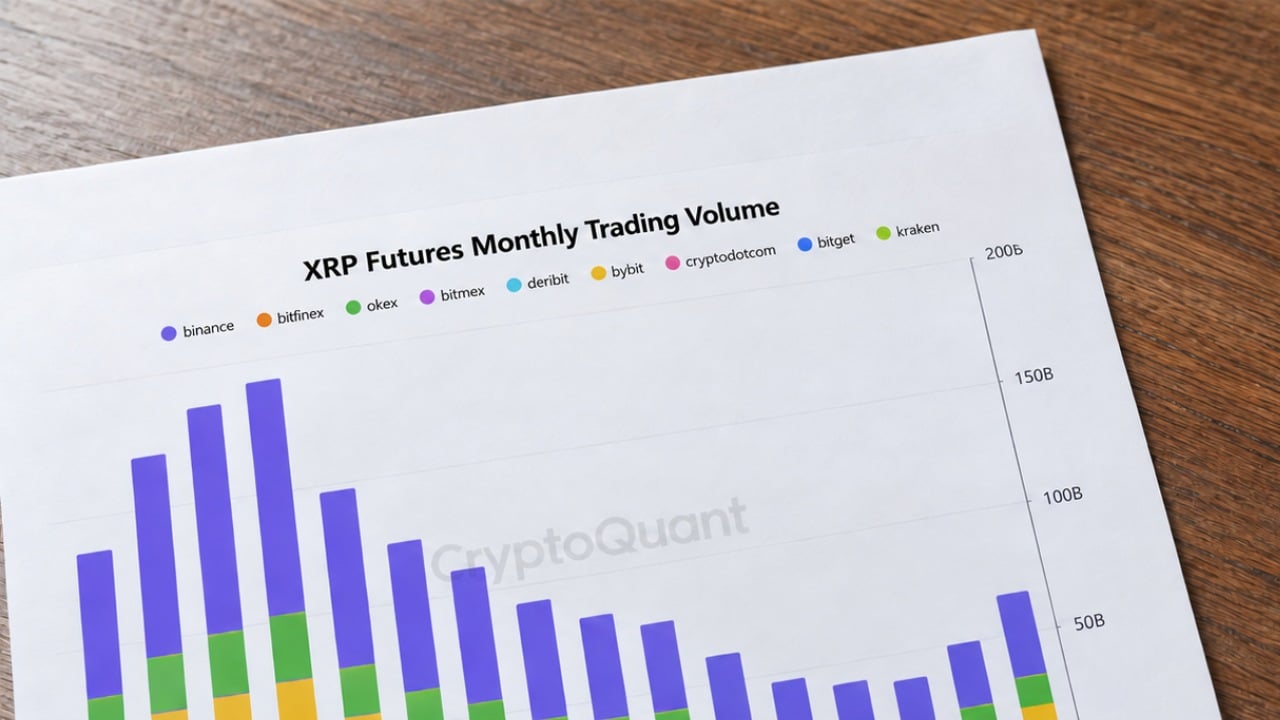
XRP holds near $1.50 as Korean and futures trading stays active
XRP traded near $1.50, inside a reported $1.45 to $1.52 range. The token ranked first in trading volume in South Korea, ahead of Bitcoin and Ethereum, according to CoinMarketCap data.
 SUI
+1.6%
SUI
+1.6%Altcoins show mixed price action as various tokens test resistance levels
Altcoins experience varied price movements while testing key chart levels and moving averages. XRP trades near $1.52 with support from rising short-term moving averages.
A video appearing here is not an endorsement. Crypto assets can lose value. This page provides information, not investment advice.